Bode graphs are representations of the magnitude and phase of G(j*ω) (where the frequency vector ω contains only positive frequencies). These consist of two graphs.
The first plot is a plot of log modulus i.e.|G(j ω)| (in decibels) versus frequency. The magnitude of |G(j ω)| of any transfer function for any value of ω is plotted on a logarithmic scale in decibels where db = 20log10| P(j ω) |
The second plot is the phase shift (in degrees) versus frequency (ω).
Both plots usually have the frequency (ω) in logarithmic scale from 0 to ∞ .
It is very easy to produce Bode plots by hand or by using proprietary software packages such as Matlab. Links below show how Bode plots can be produced using Excel and using Mathcad. The example plots below have been produced using Mathcad
When considering relatively complicated transfer functions which are the product of a number of terms i.e
![]()
The bode magnitude plots can be obtained by adding the bode magnitudes (20Log10|G(iω)|) plots for the individual factors i.e
20 log10|G(ω)| = 20 log10|100| + 20 log10|(1 +j ω| + 20 log10|(2 +j 3ω| + 20 log10| /(2 +j ω| + 20 log10| 1 / (3 - j ω| + 20 log10| 1 / (2 + j 2ω|
Arg G(ω) = ArgG(100) + ArgG((1 +j ω) + ArgG((2 +j 3ω) + ArgG(1 /(2 +j ω) + ArgG( 1 / (3 - j ω) + Arg(G( 1 / (2 + j 2ω)
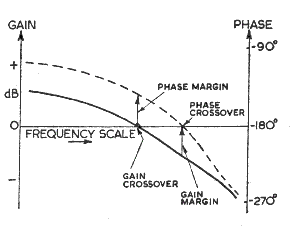
Two relative stability indicators "Gain Margin" and "Phase Margin" are easily obtained from Bode Plots. As 0 db corresponds to a magnitude of 1 the gain margin is the number of db that |G(iω)| is below 0 db at the phase frequency when the phase arg(G(iω)= 180o (Phase crossover). The phase margin in the number of degrees arg(G(iω) is above -180o frequency associated with a gain |G(iω)|= 1 (0 db) (Gain crossover)
If the gain margin and phase margin are both positive the system will be stable. The stability should also be checked using Nyquist or other noted methods for complete certainty.
These are illustrated by plotting two typical Bode plots together as shown below
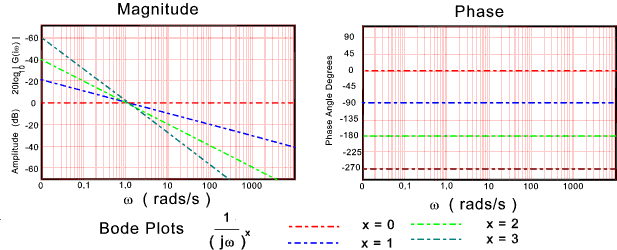
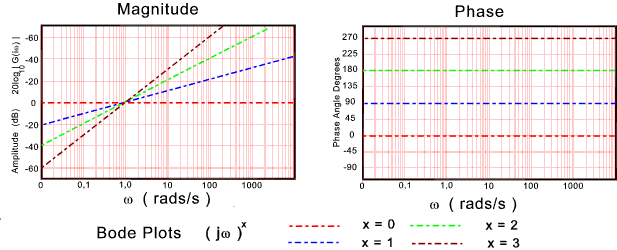
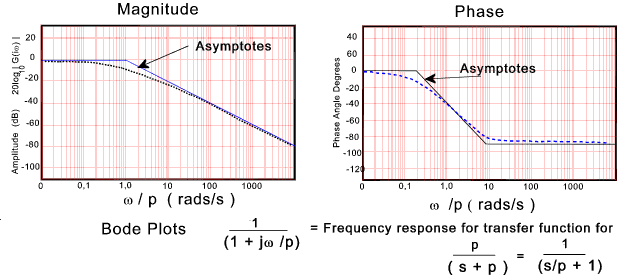
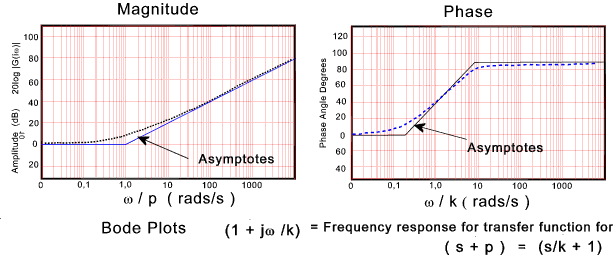
A small number of typical bode plots are provided to indicate the various shapes. Relatively complicated bode plots can easily be produced by combining the plots below and adding the appropriate log values for constant products and divisors...
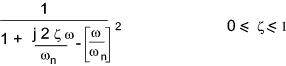
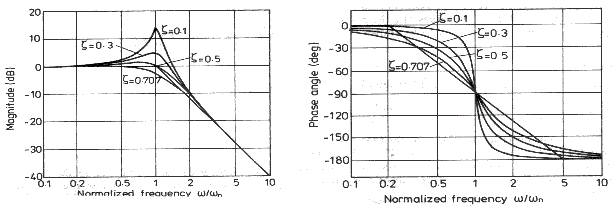
Many control systems are described by a general second order differential equation..
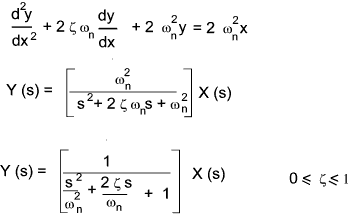
The resulting frequency response function and the associated normalised bode plots are show below